 With over 8 hours of training tutorials, our BusinessObjects: Business Intelligence bundle is designed for managers and project team members, who are responsible for extracting and analyzing information using SAP BusinessObjects With over 8 hours of training tutorials, our BusinessObjects: Business Intelligence bundle is designed for managers and project team members, who are responsible for extracting and analyzing information using SAP BusinessObjects
Our BusinessObjects Training Bundle consists of the following training courses:
- Overview
- BusinessObjects: Crystal Reports
- Web Intelligence
- Dashboards and Analytics
- InfoView
- Business Intelligence BI
Training Includes the Following:
 Full multi media training lessons Full multi media training lessons
 Course contains interactive exercises to practice one's skills Course contains interactive exercises to practice one's skills
 Review Questions Review Questions
 Does not require SAP software Does not require SAP software
 Printable transcripts of all lessons Printable transcripts of all lessons
Overview
One of the most valuable assets an enterprise can possess is data - information acquired and stored in the process of carrying out everyday business activities. This includes data regarding customers and potential customers, employee-related information, data gathered concerning competitors, and information pertaining to products. In order to take full advantage of its information assets, an enterprise must be able to store and utilize data wisely. The SAP Business Objects Business Intelligence suite of applications provides the enterprise with a comprehensive set of reporting and analysis tools that enables timely and accurate presentation of data, including that obtained from SAP and non-SAP information stores.
You will Learn to:
- SAP Business Objects solution categories with their corresponding tools
- Crystal Reports field menu options with corresponding descriptions of when they would be used
- Reporting and analysis concepts with their corresponding definitions
- Dashboard applications
- Features of various tools
- Creating a financial report using Desktop Intelligence
- Features of a reporting tool to fulfill user requirements
- Web Intelligence features are used to meet user requirements
- Using tools to create reports
Crystal Reports
Business data is stored in various formats, and comes from a variety of sources. The volume and variety of business data presents immense potential for understanding and responding to customer requirements and business process optimization. In order to realize this potential, SAP provides the Crystal Reports reporting tool. Crystal Reports has supplanted the Business Explorer report designer as SAP's standard enterprise reporting tool. Crystal Reports provides the interface to allow business users to extract and present formatted, layout-centric reports from business data. Crystal Reports provides a very user-friendly interface to various data sources, including data sources outside of the SAP realm. This course provides an introduction to the Crystal Reports reporting tool, including an initiation to the user-friendly interface, the various formatting and layout options, as well as the various methods of data access made available to all levels of users through Crystal Reports
This course will provide you with the skills to:
- Report options in the Report Creation Wizard
- Crystal Reports user interface
- Information in the Explorer tools and what appears in a report
- Hiding details in a web-based report
- Live or saved data for a given report
- Key features and concepts related to Crystal Reports
- Procedure for using the report creation wizard to create a report
- Procedure for creating a report using the Blank Report option
- Procedure for adding and formatting a report title
- Procedure for using the Dependency Checker tool
- Create a report using the report creation wizard
- Dependency Checker tool to check for errors in a report
Web Intelligence
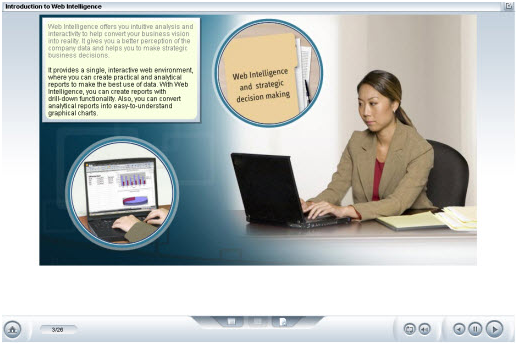
Data may be an enterprise's most valuable proprietary asset. Each enterprise possesses unique data that, when used strategically, provides a competitive advantage. Data can reveal significant information about customer behavior and preferences, and provide insight into business processes that may ultimately influence what a company sells, how products are made, and how they are sold. Getting the most out of this data will determine the ultimate value it provides to the enterprise. SAP BusinessObjects Web Intelligence is one of the industry's most flexible, user-friendly and powerful reporting solutions. It provides ad hoc query, analysis, and reporting tools in a package that is geared toward the business user. You do not have to know structured query language (SQL) to take advantage of the power offered by Web Intelligence. You can easily create and publish high-quality reports that contain drill downs, and allow readers to track changes and share business information across the enterprise. This course provides an introduction to Web Intelligence, highlighting some of its key features and benefits. You will also be able to practice using Web Intelligence tools to perform common tasks.
This training curriculum for Web Intelligence will allow you to:
- Core functionality
- Web Intelligence terms with their corresponding definitions
- Procedure for creating a query
- How to create a prompted query
- Create a prompted query using Web Intelligence
- Change the default report creation tool in Web Intelligence
- Create a report using Web Intelligence
- Procedure for creating a table from a template
- How to change the layout of an existing table
- Procedure to set the scope of analysis
- How to extend the scope of analysis for a drill-enabled data element
- Create a table in Web Intelligence
- New table from a template and then modify its layout
- Drill down in a table and expand the scope of analysis for the data element
SAP BusinessObjects: Dashboards and Analytics
The typical enterprise generates hundreds of management reports on a weekly basis. As companies grow and continue to add new channels, benchmarking and weekly reporting are key to helping top management keep a finger on the pulse of the business. With all those reports to wade through, business executives need a reporting format that provides the information they need at a glance. The corporate dashboard report does just that. It contains a series of dials in a corporate cockpit that reflect the key performance metrics from each department. Dashboarding involves the presentation of key business data in a very concise visual manner. SAP's Business Objects offers dynamic, customizable data visualization tools that allow you to create insightful and powerful dashboards from various data sources. These tools are intuitive and appropriate for users of all skill levels. This course provides an introduction to dashboarding. You will learn how to create dashboards using SAP InfoView, Xcelsius, and Dashboard Builder.
Learn to:
- Characteristics of a dashboard
- Types of dashboard analytics with the types of information that each one is designed to portray
- Creating a dashboard using InfoView
- Creating an analytic using Dashboard Builder
- Panes of the Xcelsius designer interface
- Procedure for creating a dashboard using Xcelsius
- Create a dashboard using InfoView
- Create a dashboard using Xcelsius
- Create an analytic using Dashboard Builder
InfoView
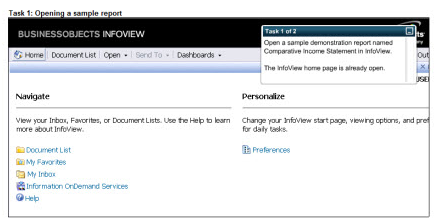
SAP BusinessObjects provides various tools for enterprise reporting purposes. InfoView is a web-based application that provides an interface for users to perform common activities, such as viewing or modifying reports, without having to install any additional software on their systems. InfoView can work with Xcelsius, Crystal, and Web Intelligence documents. It allows you to publish reports to common formats, such as PDF or MS Word, as well as alter a report's underlying data. This course provides an introduction to the essential features and functions of SAP InfoView and provides a look at some of the common activities performed using InfoView.
This training tutorial will allow you to:
- Features of the InfoView user interface
- How to access the sample reports
- InfoView reporting applications with key characteristics
- Recognize the procedure for creating a new folder or category
- Open a sample report
- Create a new folder or category in the navigation panel
- Creating a document
- Saving a document
- Giving a report a title
- Recognize the procedure for publishing a report
- Match InfoView publishing options to their corresponding benefits and drawbacks
- Create a report
- Publish a report
Business Intelligence BI
Businesses generate a large amount of data in the everyday operation. This data is extremely valuable and may be used by employees at every level of an organization. Before it can be utilized optimally, it must be formatted in such a way that an enterprise can capitalize on the vast amounts of data in its possession. SAP Business Intelligence (BI) is an enterprise solution that provides businesses with a comprehensive suite of tools to collect and prepare the enterprise's data for reporting and analysis purposes. With proper use of BI, an enterprise may become more organized electronically, spot trends in business, and generally have a competitive edge simply because of its ability to securely and accurately report on and analyze a myriad of data.
After viewing this training course for Business Intelligence BI you should be able to:
 Business challenges that can be overcome by adopting an enterprise data warehousing strategy Business challenges that can be overcome by adopting an enterprise data warehousing strategy- Three components of the Business Intelligence solution with corresponding descriptions
- Closed-loop business analytics process
- Data Warehousing Workbench interface
- Match components of the Data Warehousing Workbench interface with corresponding definitions
- Business Intelligence key concepts
- Opening a query in Business Explorer
- Perform using Business Explorer Analyzer
- Importing data from an external database using Business Explorer Query Designer
- SAP Business Explorer to open a query and import data from an external database
|