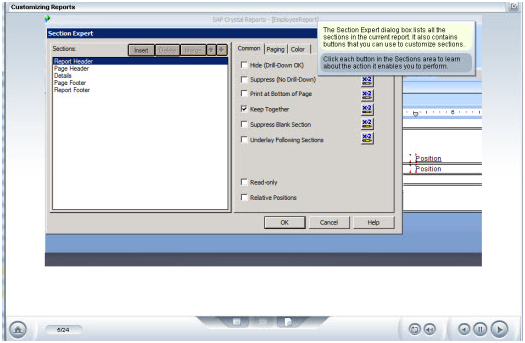
Business data comes from a variety of sources and is stored in various formats. The volume and variety of business data presents immense potential for understanding and responding to customer requirements and business process optimization. In order to realize this potential, SAP provides our Crystal Reports 2011 training will show you hot to use this powerful reporting tool. In your lessons you will be shown how Crystal Reports 2011 allows business users to extract and present formatted reports from business data. Our Course will take you through its very user friendly interface to access various data sources including database, MS-excel, and flat text files. This course provides lessons for the Crystal Reports 2011 reporting tool including an initiation to the user-friendly interface and the various formatting and layout options as well as the various methods of data access made available to users through Crystal Reports 2011 (XI).
Target Audience
Individuals, such as managers, business support staff (secretarial) and project team members – those responsible for extracting and analyzing a variety of information about a business using Crystal Reports
Training Courses Include
Full Multi Media Training Course
Interactive Labs and Exercises
Printable Transcripts of all lessons - no need for books.
Certificate of Completion
Training Time 9 Hours
Course Outline
Getting Started with Crystal Reports 2011
- Features of Crystal Reports
- Crystal Reports interface elements
- Create a report using the Report Creation Wizard
- Create a report from scratch
- Use an existing report as a model for creating new report
- Tailor the presentation of data in reports
- Customize a report
- Organize data using sorting, filtering, and summarizing
- Formulas in Crystal Reports
- Reports in a specified format
- Organize data to display in a specified way
- Distribute reports
Report Writing Basics XI
- How to implement a structured approach to report design.
- New features in Crystal Reports XI.
- How to customize the environment.
Managing Data and Distributing Reports XI
- Organize data in a report, in a given scenario.
- Use summaries to structure and display report data effectively, in a given scenario.
- Group, Summarize and Sort data.
- Basic formula in the Formula Workshop.
- Insert a basic chart into a report.
- Ad a formula and a chart to a report.
- Perform basic formatting on a report.
- Distribute a report, in a given scenario.
- Format and export a report for distribution.
|